


Speculative. Exuberant. Unmoored. These words have resurfaced in conversations about today’s U.S. small-cap market. A more precise description may be nonfundamental. Looking at market leadership throughout much of 2025 and early 2026, price appreciation among many of the top-performing stocks has been driven more by narrative than by earnings power. Many of the strongest performers in the U.S. small-cap market are tied to popular investment themes but have yet to demonstrate profitability—and in some cases lack revenue altogether.
For investors who experienced the late 1990s, the pattern feels familiar. At the height of the dot-com bubble, nearly a fifth of the Russell 2000® Growth Index consisted of companies trading at 30 times sales or more — a group we would broadly classify as nonfundamental. In late 2025, this cohort reached its largest weighting in the Index since that period (see Figure 1).
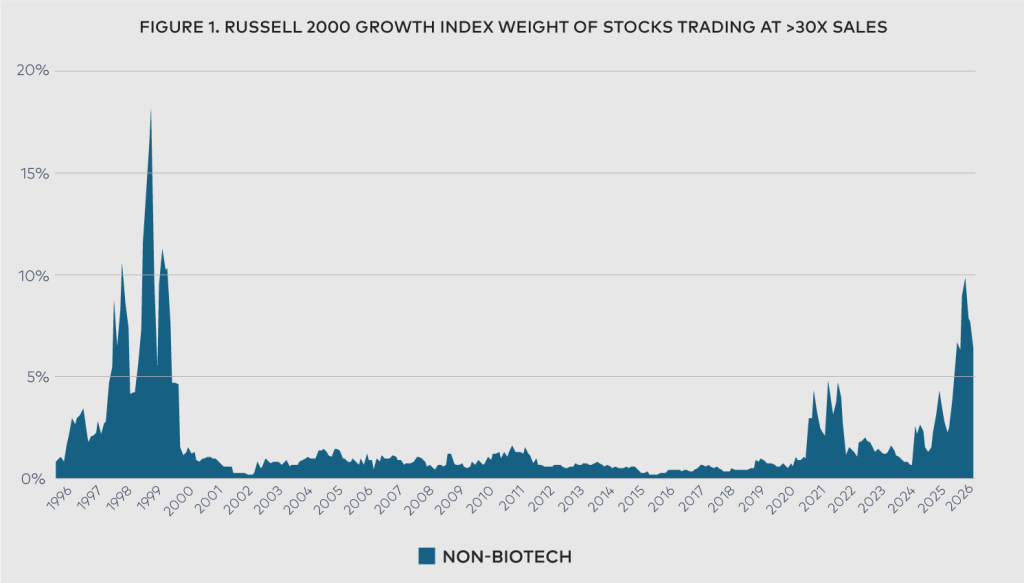
Does that mean markets are headed for a downturn, similar to the early 2000s? No one can predict such outcomes, and there are legitimate reasons to be constructive on the earnings power of many small-cap businesses. Still, when nonfundamental companies command an outsized share of market leadership, history offers perspective. The period following the dot-com bubble underscores the importance of adhering to fundamentals—a discipline that remains the bedrock of Wasatch’s investment process today.
MARKET LEADERSHIP, THEN AND NOW
For the charts that follow, we define the “nonfundamental” group as companies trading at 30 times sales or more, excluding biotechnology firms. Early-stage biotech businesses often command elevated multiples, given the binary nature of scientific development and the potential for future commercialization. Outside of that context, however, such valuations warrant closer scrutiny.
During the dot-com bubble, most companies in the nonfundamental cohort were built around the promise of the internet. Today, the group is concentrated in companies tied to popular themes including artificial intelligence (AI), quantum computing, cryptocurrency, nuclear power and rare earth mining. Many of these themes intersect with the buildout of AI infrastructure.
Like the internet before it, AI is a transformative innovation. At Wasatch, we are not ignoring that opportunity. We invest in companies benefiting from the AI buildout, but we focus on businesses already generating revenue and demonstrating tangible earnings power. We have avoided companies with nascent models that remain dependent on future breakthroughs or distant commercialization. Quantum computing illustrates this distinction. Many companies in the space acknowledge that the technology remains several iterations away from a commercially viable
breakthrough. While a successful outcome could ultimately create substantial value, the timing and probability of that success are highly uncertain. We prefer to invest once a company’s competitive advantage and earnings trajectory are clearer.
FIGURE 2. PERCENT OF COMPANIES DOWN MORE THAN 75% FROM THE DOT-COM PEAK
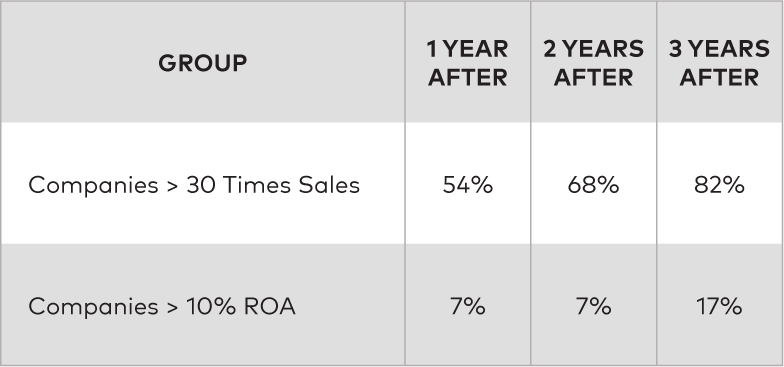
The experience following the dot-com bubble reinforced a durable lesson: Over time, investors were rewarded for owning businesses with solid fundamentals rather than those sustained primarily by narrative. Figure 2 above illustrates the benefit of adhering to fundamentals rather than chasing the high-returning, nonfundamental cohort. The chart compares the nonfundamental group to companies generating a return on assets (ROA) of 10% or greater—a straightforward measure of business quality. In the three years following the bubble’s peak, more than three quarters of the nonfundamental stocks fell by 75% or more. By contrast, companies with stronger fundamentals experienced materially better outcomes.
THE LONG VIEW: FUNDAMENTALS MATTER
In the run-up to the dot-com bubble, companies with compelling narratives but limited fundamentals delivered strong returns—much as they have recently. As the prior charts illustrate, however, that outperformance reversed sharply when the bubble burst. A longer-term perspective reinforces the case for emphasizing business quality over thematic momentum.
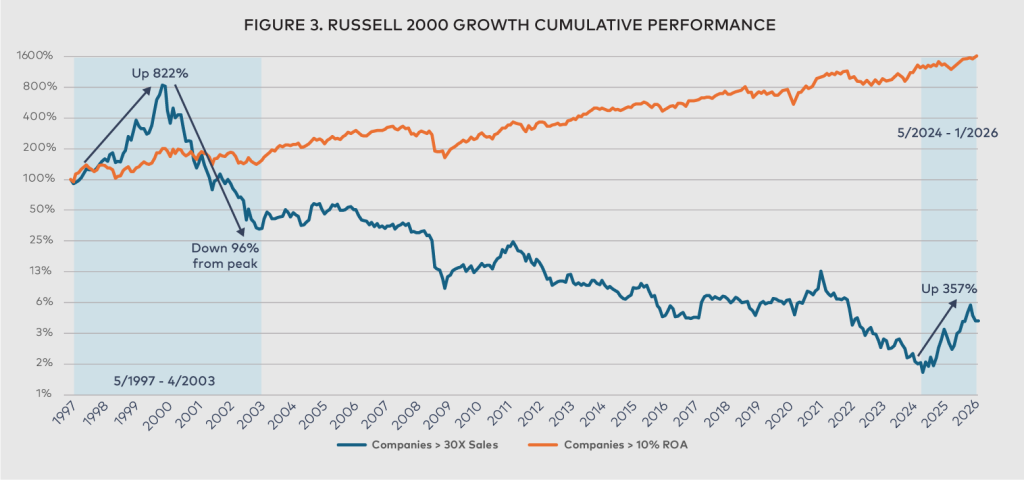
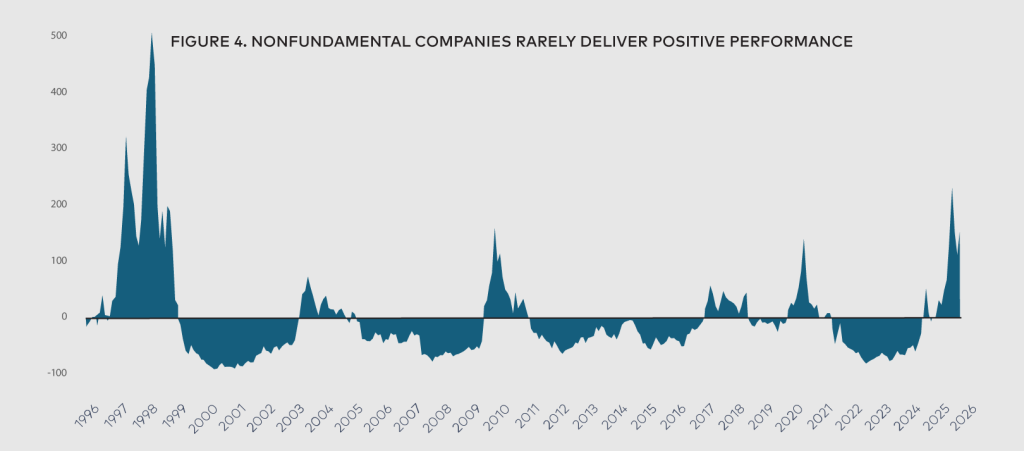
Figure 3 above compares the cumulative performance of the nonfundamental cohort with the group with an ROA greater than 10%. Figure 4 below presents rolling two-year returns for the nonfundamental group, highlighting the episodic nature of its outperformance. Historically, periods of excess return for nonfundamental companies have been concentrated in relatively brief windows that are followed by extended stretches of underperformance.
SPECULATIVE COMPANIES OFTEN FAIL TO “GROW INTO” THEIR VALUATIONS
A common counterargument is that companies trading at elevated multiples may eventually justify those valuations as their businesses mature. The question, then, is how often such companies ultimately develop the earnings power necessary to support even a premium valuation on a traditional earnings basis.
History suggests that outcome is the exception rather than the rule. Over the past few decades, only about one in five companies that entered our nonfundamental cohort went on to achieve a valuation under 50 times earnings within five years.
BALANCING INNOVATION AND FUNDAMENTALS
Innovation has always reshaped markets. The internet transformed commerce and communication, and AI may prove equally consequential. Periods of rapid technological change often bring elevated expectations and strong performance for companies aligned with emerging themes. History shows, however, that over full market cycles, durable returns tend to accrue in businesses that convert innovation into sustainable revenue, earnings and cash flow. While speculative leadership can persist, valuation and fundamentals have ultimately reasserted themselves.
We saw this play out in the early 2000s. The run up to the dot-com bubble was a challenging period for Wasatch performance, just as it is today. Back then, we did not chase the narrative-driven, often nonfundamental companies that were leading the market. Once the bubble burst, we were rewarded for owning companies with proven earnings power and strong fundamentals. Figure 5 below puts this in perspective, showing the relative performance of the Wasatch Small Cap Core Growth strategy in the run-up to the dot-com bubble and after. Performance was similar for Wasatch’s other U.S. small-cap strategies. The years that followed the dot-com bubble marked one of the greatest periods of Wasatch outperformance in our firm’s 50-year history.
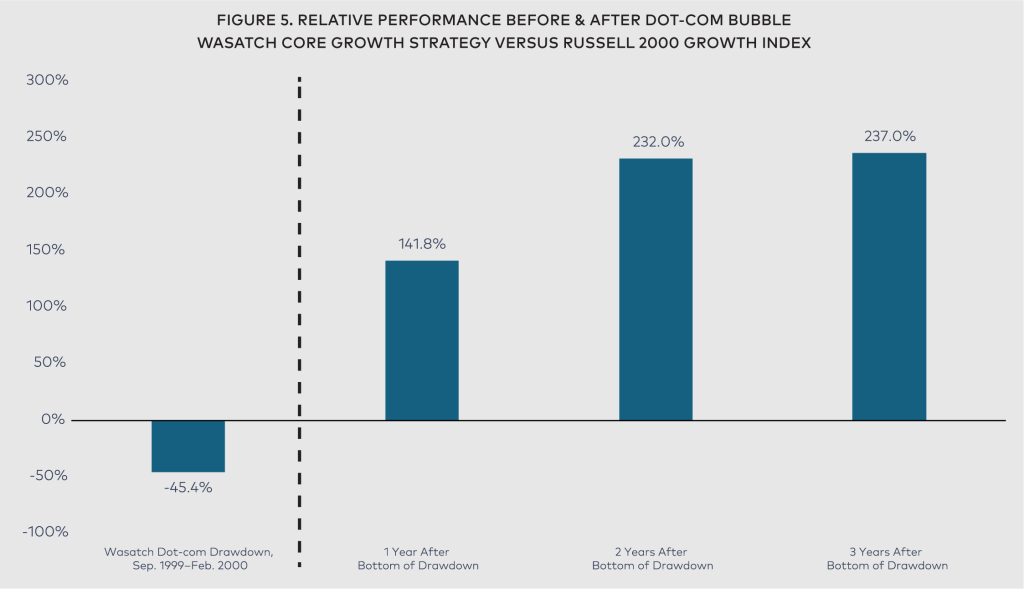
Flash forward to today’s market environment, and we’re applying the same discipline we did back then. Earnings growth and business quality remain the hallmarks of Wasatch’s investment process. We do not claim to know when market leadership may shift. But the lessons of the past are clear: Owning companies with demonstrable earnings power and resilient business models provides a more reliable foundation for long-term compounding.
RISKS AND DISCLOSURES
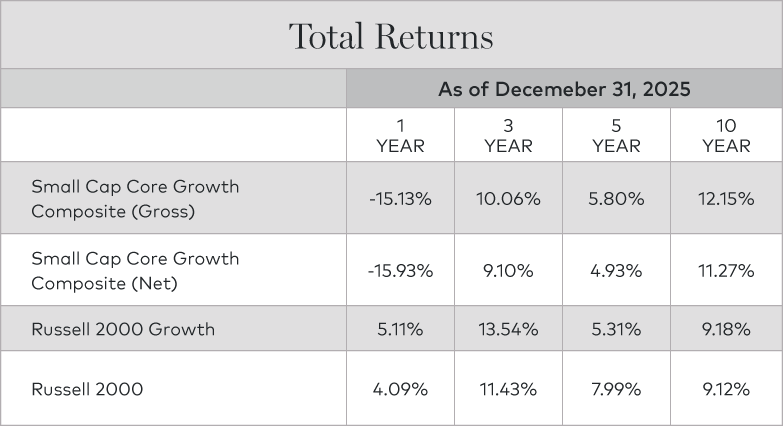
Returns for periods greater than one year are annualized.
Investments in small-cap companies may be more volatile and carry greater risk of loss than investments in larger, more established companies. A concentrated investment approach, such as investing in a limited number of holdings, can increase the impact of adverse developments in a single region, sector or issuer. Investors should consider their investment objectives and risk tolerance before investing.
Information in this document regarding market or economic trends or the factors influencing historical or future performance reflect the opinions of management as of the date of this document. These statements should not be relied upon for any other purpose. Past performance is no guarantee of future results, and there is no guarantee that the market forecasts discussed will be realized.
DEFINITIONS
Return on assets (ROA) measures a company’s profitability by showing how many dollars of earnings a company derives from each dollar of assets it controls.
Earnings growth is a measure of growth in a company’s net income over a specific period, often one year.
Valuation is the process of determining the current worth of an asset or company.
A representative account is selected based on accounts with substantially similar investment policies, objectives and strategies that closely resemble, or are most representative of, the strategy it represents.
The Russell 2000 Growth Index measures the performance of those Russell 2000 Index companies with higher price-to-book ratios and higher forecasted growth values. Indexes are unmanaged. Investors cannot invest in these or any indexes.
Wasatch Global Investors investment strategies have been developed solely by Wasatch Global Investors. Wasatch’s investment strategies are not in any way connected to or sponsored, endorsed, sold or promoted by the London Stock Exchange Group plc and its group undertakings (collectively, the “LSE Group”). FTSE Russell is a trading name of certain of the LSE Group companies.
All rights in the Russell 2000 Growth vest in the relevant LSE Group company that owns the Index. Russell® is a trademark
of the relevant LSE Group company and is used by any other LSE Group company under license.
The Index is calculated by or on behalf of FTSE International Limited or its affiliate, agent or partner. The LSE Group does not accept any liability whatsoever to any person arising out of (a) the use of, reliance on or any error in the Index or (b) investment in or operation of Wasatch’s investment strategies or the suitability of the Index for the purpose to which it is being put by Wasatch Global Investors.